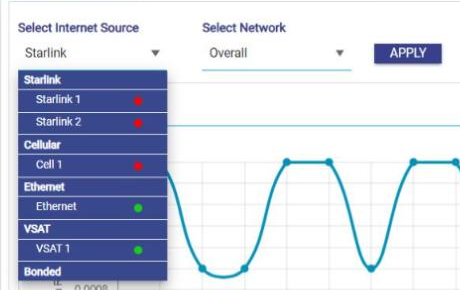
The Performance Charts area provides comprehensive time chart functionality to plot Internet Source (WAN) links metrics over selectable time periods for any given Network. Once the EpicOS System is configured, user can monitor the performance of the interface or WAN links.
The following metrics are available:
-
Data Rates
-
Native Link Status, with Probe Success and Down Time
-
MPK Link Status
-
Latency & Jitter
-
Speed Test Results, with Peak Rate
To view the performance charts, perform the following steps.
-
Log on to the EpicOS System. The home page appears.
-
Select Monitors from the side bar.
-
Select Performance Charts. The Performance Charts page appears. See figure below.
Note: The time period of the charts is selected from the period drop-down at the top right of the Monitors screen. The available options are Last 15 mins, Last 1 hour, Last 2 hours, Last 6 hours, Last 12 hours, Last 24 hours and Last 7 days. By default, Last 15 mins is selected. The same period applies to the Performance Charts, Weighting Charts and Usage Status tabs.
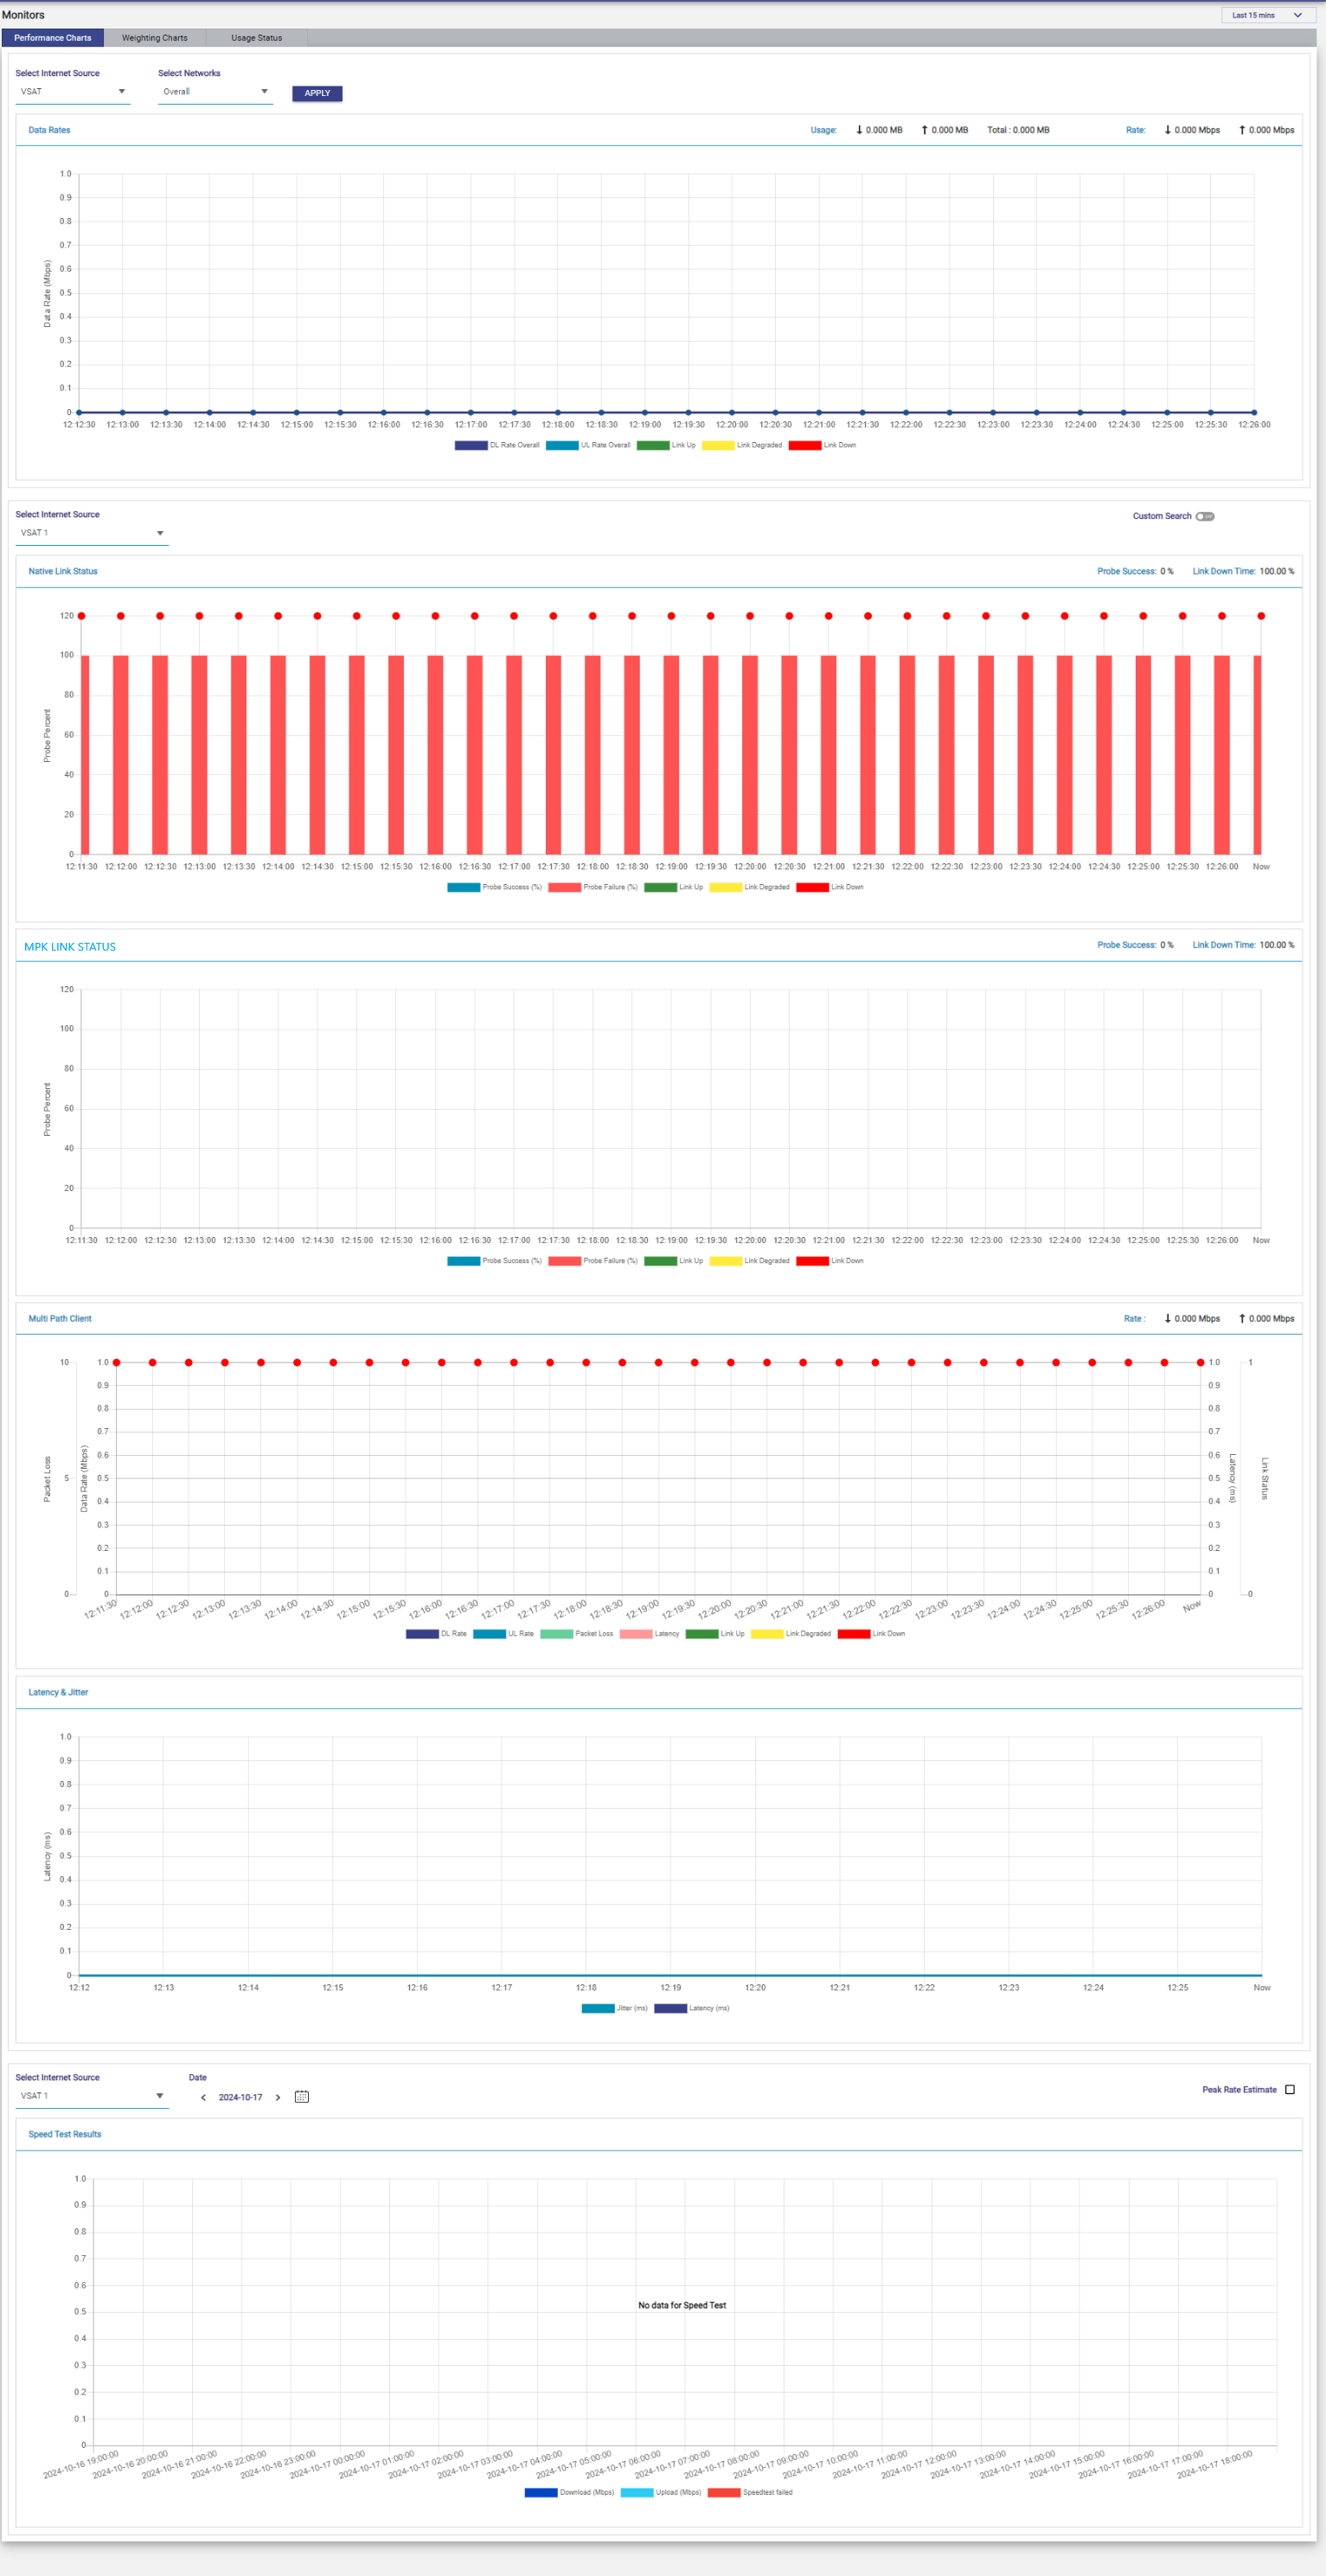
For description of the information displayed on the Performance Charts, see Table below.
|
Fields |
Description |
Configuration |
|
Data Rates |
DL/UL rates chart of the internet source for a specific network is generated. The header of the Data Rates chart shows the Usage (download, upload and total data in MB) and the current Rate (download and upload in Mbps) for the selected period. The chart legend shows the DL Rate and UL Rate lines along with the Link Up, Link Degraded and Link Down indicators. |
To view the DL/UL rate chart for a network, perform the following steps. Steps
The performance chart is generated. See Figure Select Internet Source below the table.
If the network selected in the Network list does not apply to the internet source selected in the Internet Source list, then the alert is displayed. |
|
Link Status |
The status chart of the probe and link is available. |
To view the link status chart for a network, in the Internet Source field, select a WAN link or an internet source. The performance chart is generated. Or, To view the link status chart for a network based on day and time, perform the following steps. Steps
The chart is generated. Additionally, Probe Success % and Link Down Time % is also available. When Custom Search is on, a Reset Zoom button is available on the charts to return to the full time range after zooming in. Switch off Custom Search to return to the period selected at the top right of the screen. See Figure Custom Search below the table. |
|
Latency & Jitter, MPK Link Status & Multi Path Client |
These charts use the same Select Internet Source field and Custom Search option as the Native Link Status chart.
|
N/A |
|
Speed Test Results |
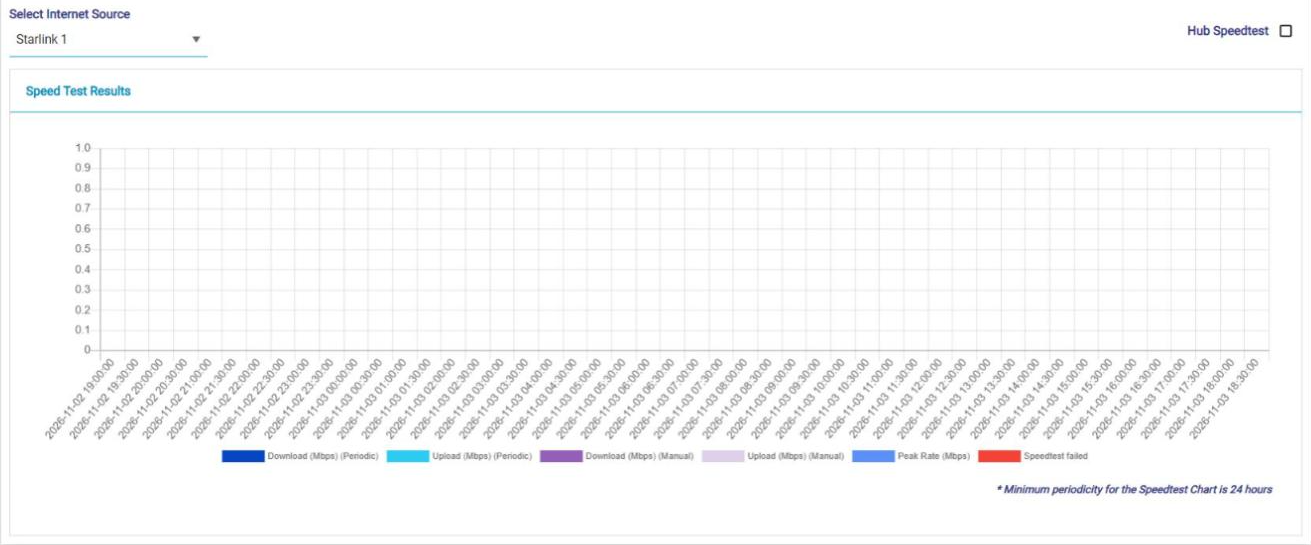
Speed test results for an interface are available. The chart shows the periodic (automatic) and manual speed test results, the peak rate, and failed speed tests. The legend shows Download (Mbps) (Periodic), Upload (Mbps) (Periodic), Download (Mbps) (Manual), Upload (Mbps) (Manual), Peak Rate (Mbps) and Speedtest failed. The periodicity of the periodic speed tests is as per the configuration set for that interface. The minimum periodicity of the Speed Test chart is 24 hours. |
To view the Speed Test Results chart, perform the following steps. Steps
See Figure Speed Test Results below the table. |
Table Performance Chart Information