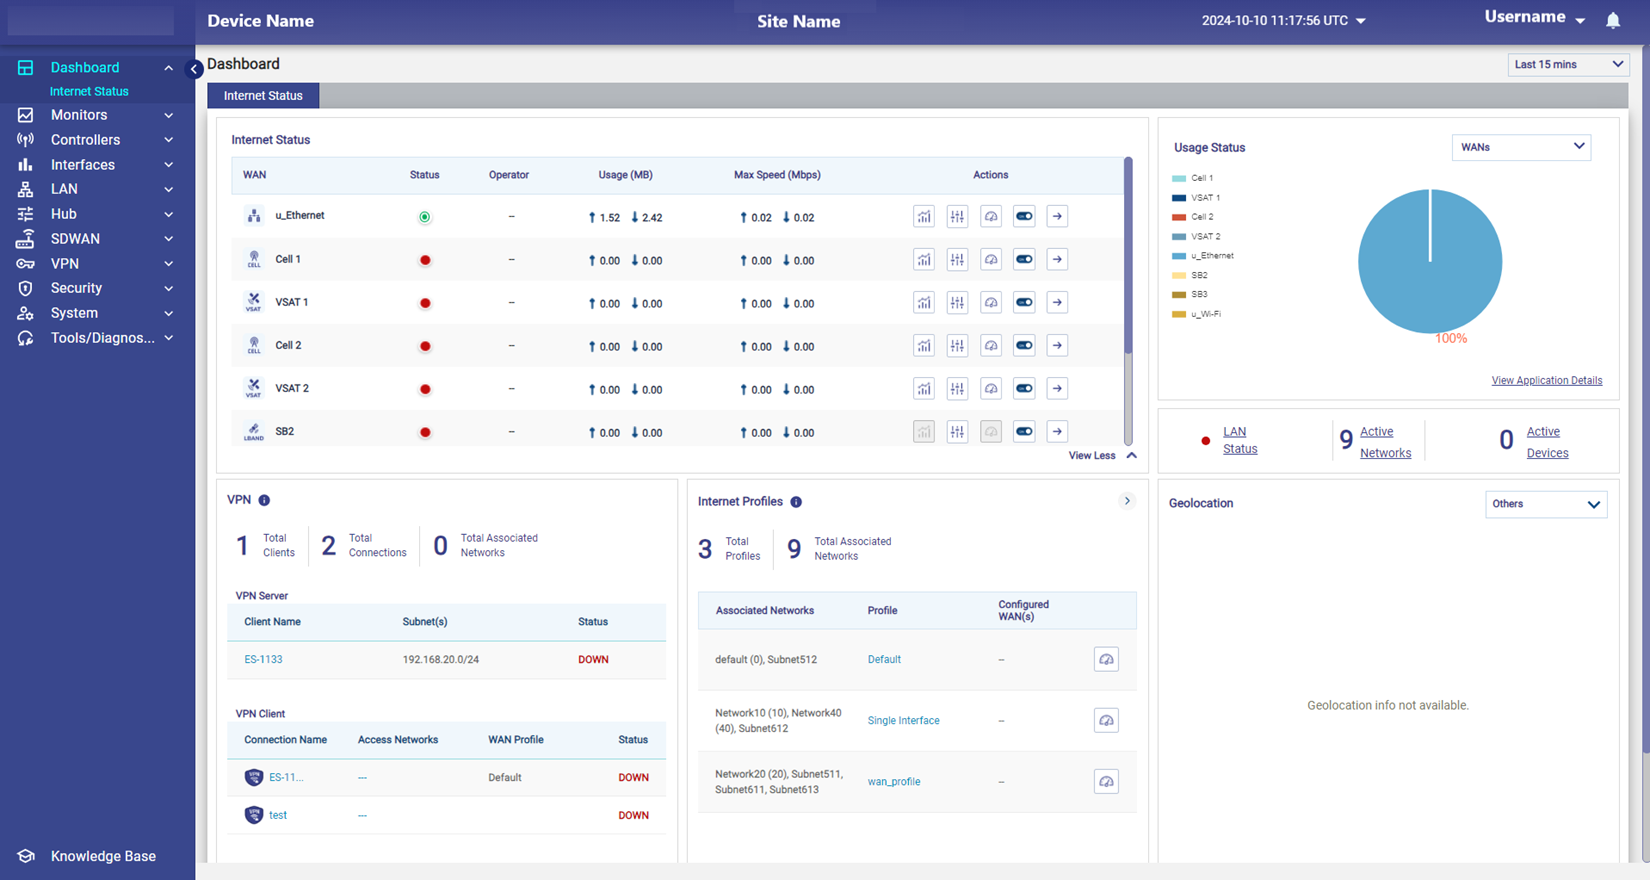
Dashboard is the landing page post user credentials validation. This screen provides a quick view of the status of the Interfaces, Network Usage across Access Networks, Active Networks and Devices, Internet Profiles and Site Location.
-
This screen is also called the Internet Status screen.
-
The Title bar shows the Site Name, Device Name, Time zone of the user, Username and the Alerts icon.
Selecting the Time zone
-
The user can select the Time zone to access the details on this screen based on the selected time zone.
-
By default, the UTC time zone is configured.
-
The user can select any time zone from the following options:
-
UTC
-
EST
-
CST
-
MST
-
PST
-
AST (Atlantic)
-
HST (Hawaii)
-
CET (Central Europe)
-
EET (Eastern Europe)
-
WET (Western Europe)
-
BST
-
UAET (United Arab Emirates)
-
SGT
-
NZST
-
IST
-
Periodicity
-
The user can view the Internet Status of the system based on different time periods by selecting from the Periodicity dropdown menu at the upper-right corner of the page below the title bar .
-
The available options are Last 15 minutes, Last 1 hour, Last 2 hours, Last 6 hours, Last 12 hours, Last 24 hours, Last 7 days, and Last 30 days. By default, the periodicity of 15 minutes is configured.
Internet Status Panel - Viewing Interfaces Status
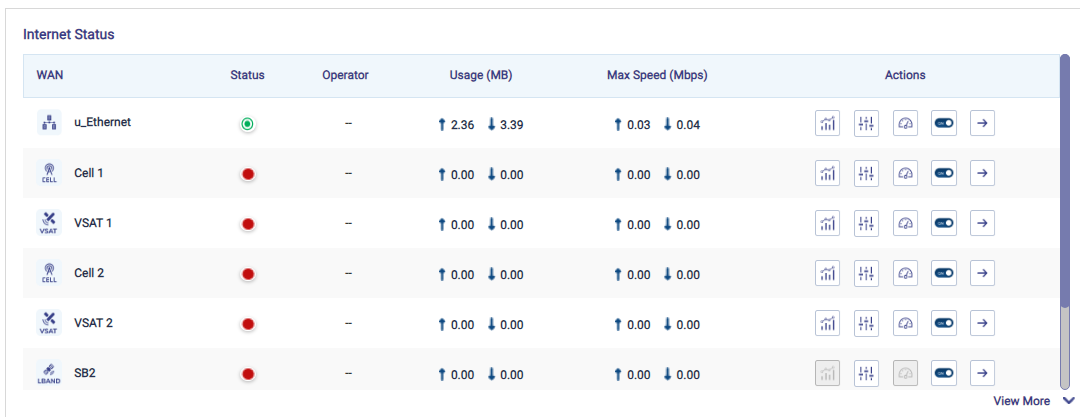
The user can view the Internet Status of all the interfaces available in the system on the Internet Status panel.
|
Fields |
Description |
Configuration |
|
WAN |
Displays the name of the Interface. |
To view details of the Interface, Click on the Interface. The user will be routed to the respective Controller page or the modem. |
|
Status |
Displays the status of the Interface. the status indicators are explained below:
|
N/A |
|
Operator |
Displays the Name of the Operator, for interface which is Active or Standby. |
N/A |
|
Usage (MB) |
Displays the upload and download data usage on the interface. |
N/A |
|
Max Speed (Mbps) |
Displays the Max upload and download speed of interface. |
N/A |
|
Actions |
There are five action buttons available per interface for the following actions.
|
For details, see following sections. Viewing Realtime Chart. Viewing Controllers. Performing Speed Test on an Interface. Disabling an enabled Interface. Enabling a disabled Interface. Viewing Performance Chart for an Interface. |

Viewing Realtime Chart
-
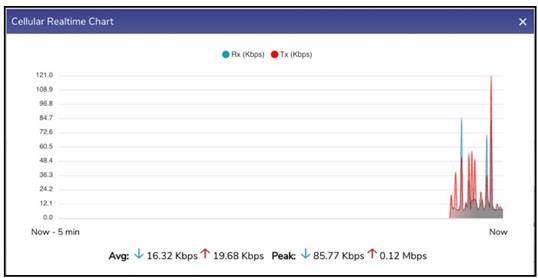
Click Realtime Chart

-
The chart plots last 5 minutes of data in the given window. The fields available on the chart are peak and average upload and download data rates.
Viewing Controllers
To view the Controller for the Interface, perform the following steps.
-
Click Controller

-
If there is no Controller for the interface, this button directs to the Interfaces Screen on the Configuration Wizard.
Performing Speed Test on an Interface
To run Speed Test on an Interface, perform the following steps.
-
Click Speed Test

-
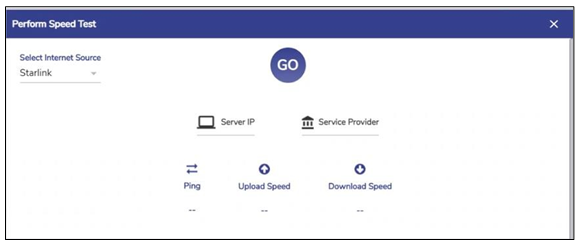
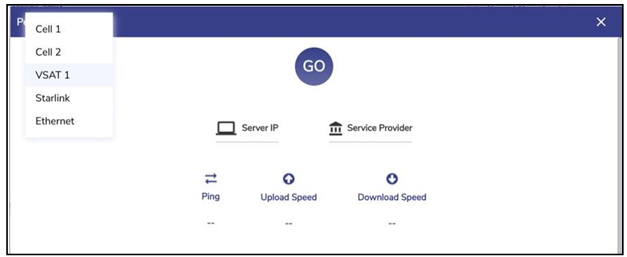
Select Internet Source from the drop-down list for which Speed Test is to be performed, see Figure Select Internet Source. By default, the interface for which the Speed Test button has been clicked is selected. Before performing the speed test, user must ensure that the internet is up on this Interface.
-
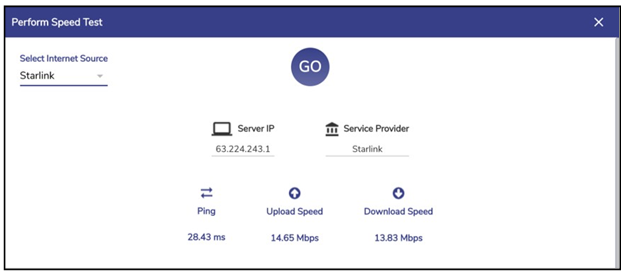
Click GO button. The Speed Test result becomes available, see Figure Speed Test Result. The output consists of Server IP, Service Provider, Ping time, Upload and Download Speed.
Disabling an Enabled Interface
To Disable an Interface, perform the following steps.
-
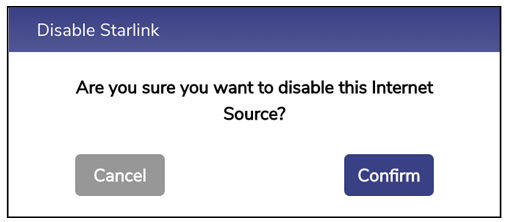
Click Toggle button

-
Click Confirm.
-
The WAN source/Interface is switched off.
Enabling a disabled Interface
To enable an Interface, perform the following steps.
-
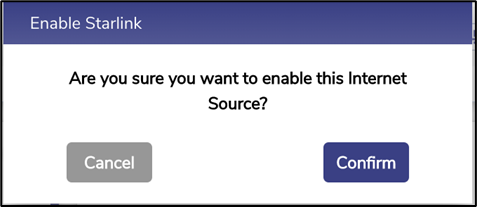
Click Toggle button corresponding to the Interface. The Enable Interface pop-up window appears, see Figure Enable Pop-up.
-
Click Confirm.
-
The Interface is switched on.
Viewing Performance Chart for an Interface
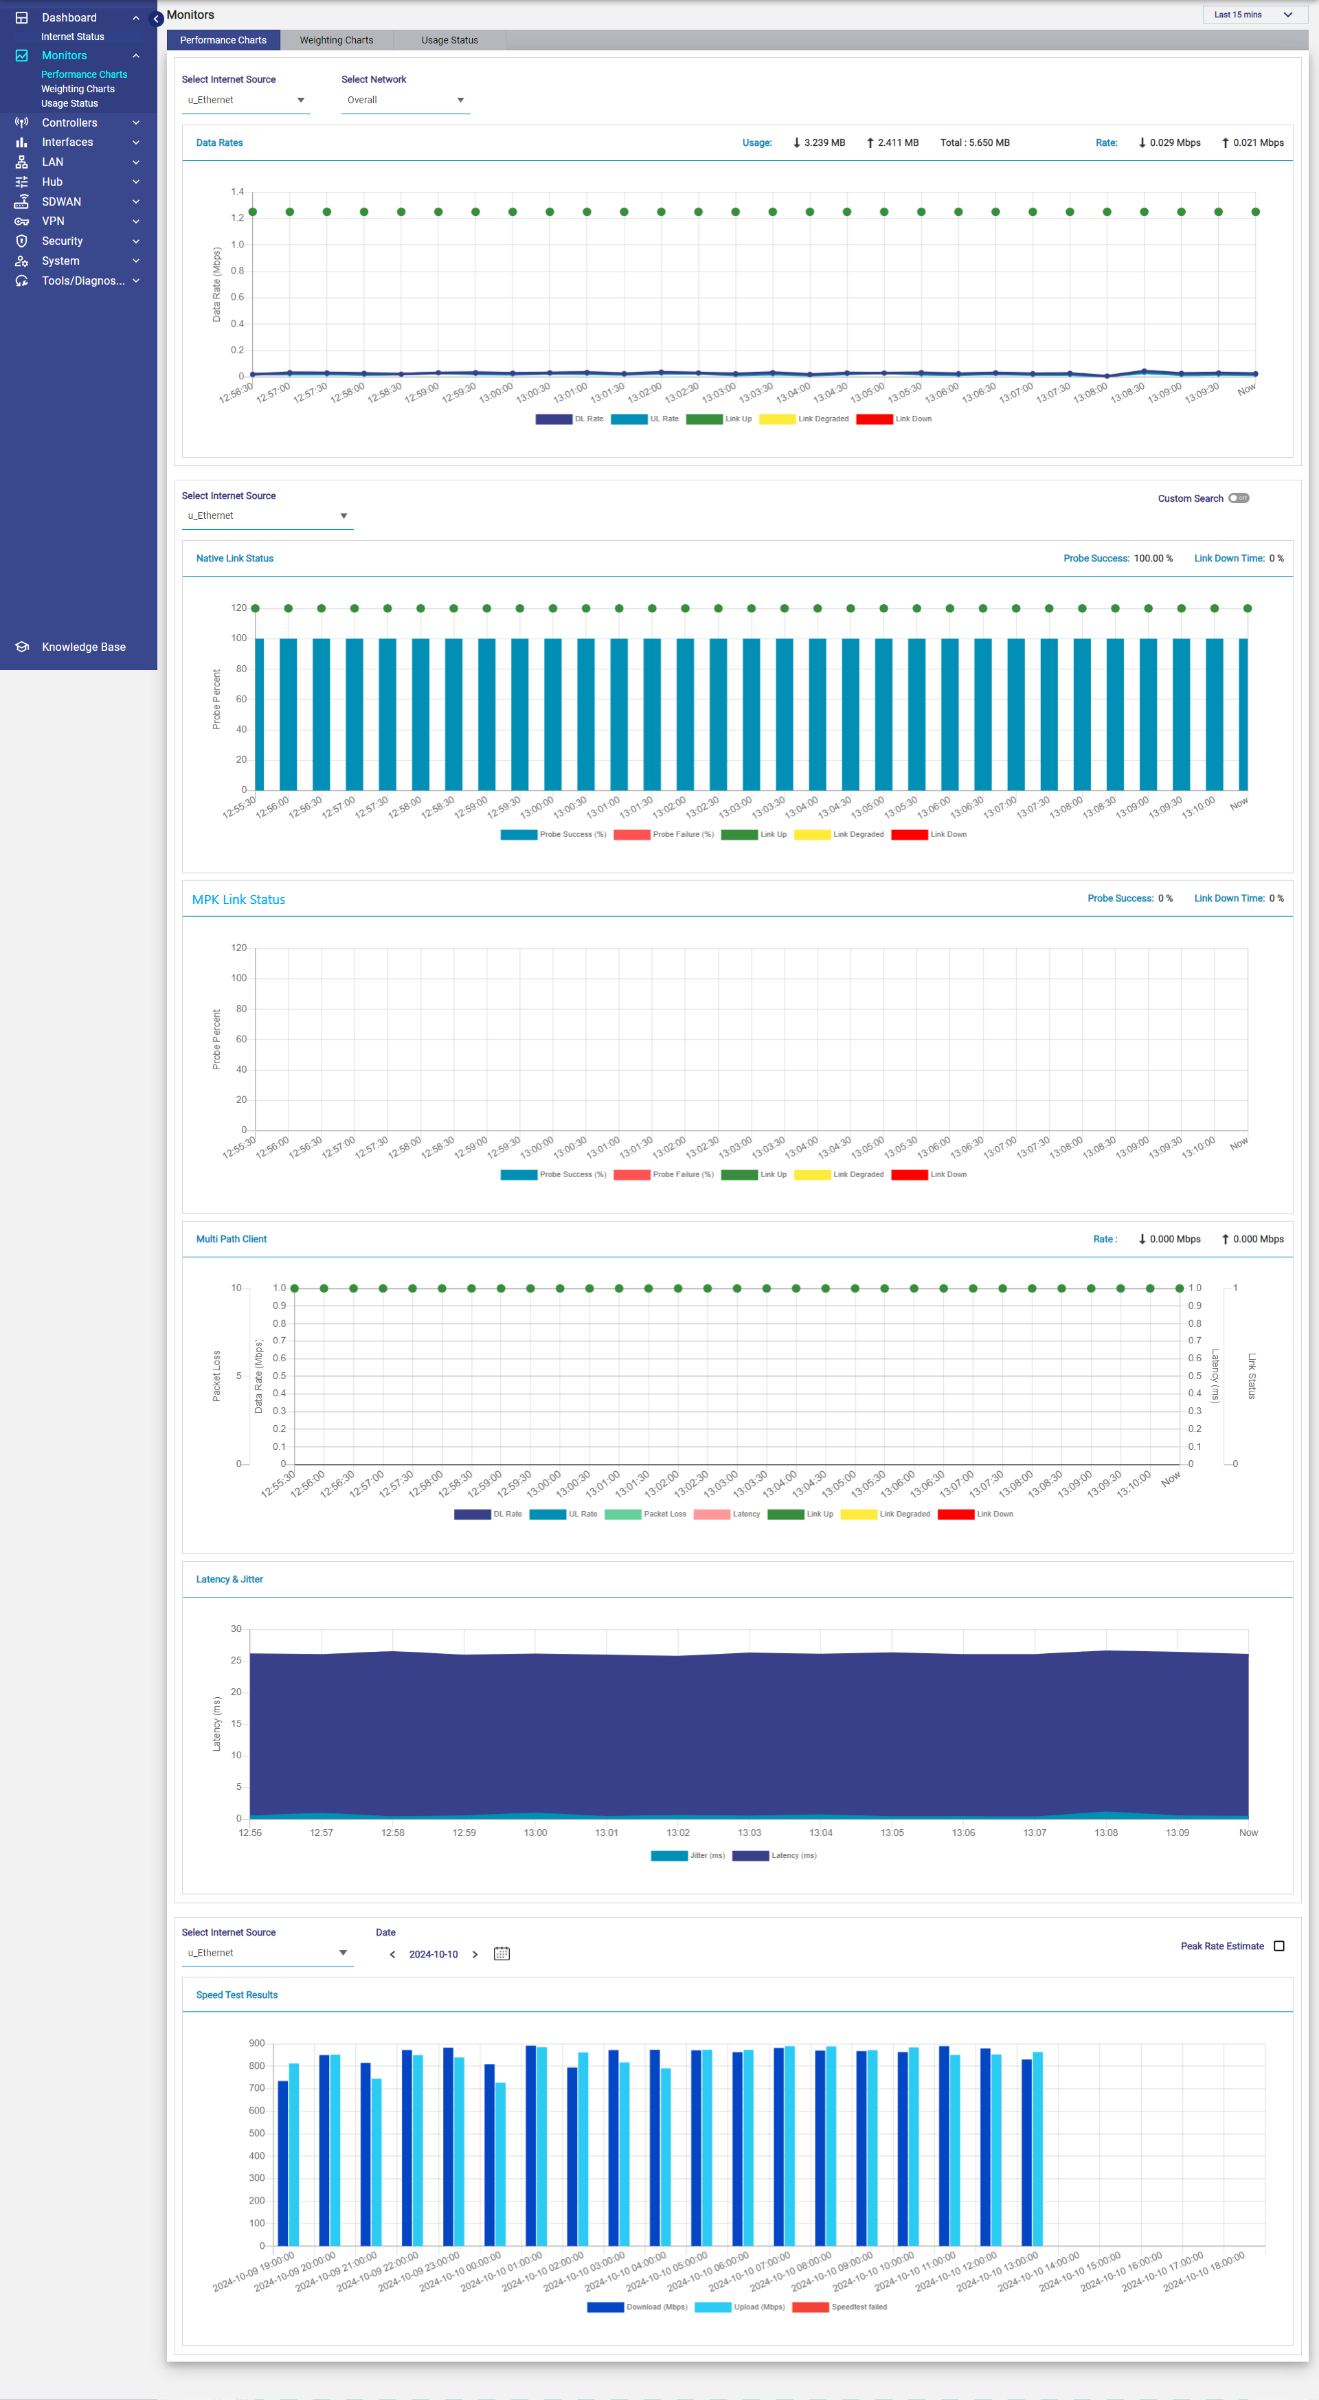
To go to the Performance Chart for an Interface, perform the following steps.
-
Click the Arrow icon Action corresponding to the Interface. The user will be directed to the corresponding interfaces’ Performance Chart Screen, see figure below.
MultiPath Konnect (MPK)
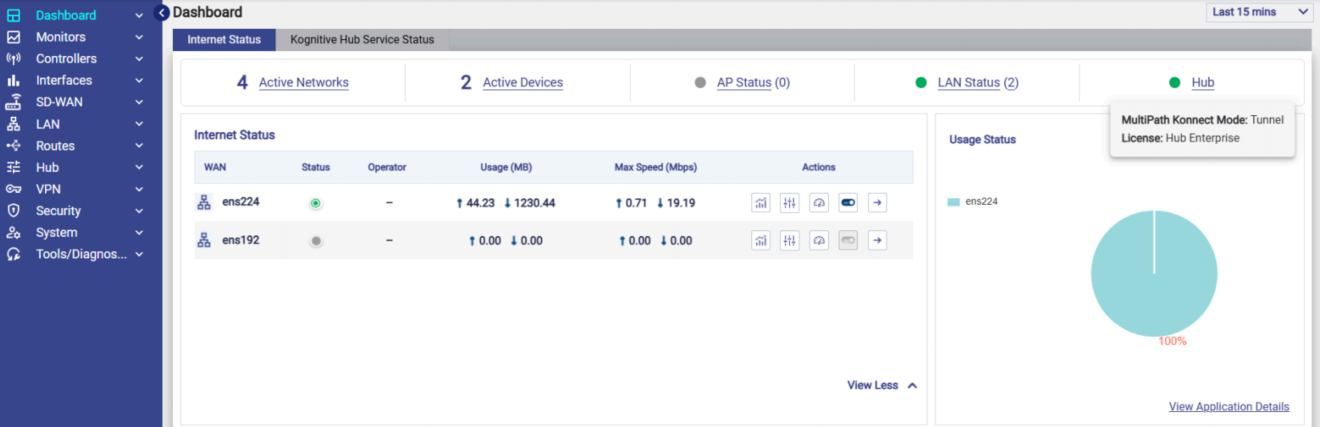
The Dashboard (Internet Status) page is enhanced to provide real-time visibility into Hub health, license capabilities, and client connection metrics based on the system’s installed license and service state.
Hub Status Indicator
A dedicated Hub Status indicator is added to the top status bar alongside existing network metrics (such as LAN Status and Active Devices). The visual state reflects the operational status of Konnect Hub Services:
|
Indicator State |
Hub Service Status |
Description |
|---|---|---|
|
Green |
Enabled |
Konnect Hub Services are active and functioning normally. |
|
Red |
Disabled |
Konnect Hub Services are inactive or disabled. |
Hub Status Tooltip
Hovering over the Hub Status indicator displays the following information corresponding to the installed license:
-
For a Hub License (License Type 3, 4, 6, 6.1): Displays the active MultiPath Konnect (MPK) Mode (PEP or Tunnel) and the Installed License Type.
-
For a Non-Hub License: Displays the active MultiPath Konnect Mode, Selected Hub Alias, Hub IP Address and Port, and the Installed License Type.
Hub Status Navigation
Selecting the Hub Status indicator provides direct navigation based on the unit's active role and status:
-
Hub-Licensed Devices:
-
Green State (Enabled): Redirects the user to the Konnect Hub Service Status tab.
-
Red State (Disabled): Redirects the user to the Hub Settings configuration screen.
-
-
Non Hub-Licensed Devices: Redirects the user directly to the Client Settings screen to review or update client MPK configurations.
Konnect Hub Service Status Tab
When logged into a device with an active Hub License and enabled Hub Services, an additional sub-tab titled Konnect Hub Service Status appears next to the Internet Status tab on the main Dashboard.
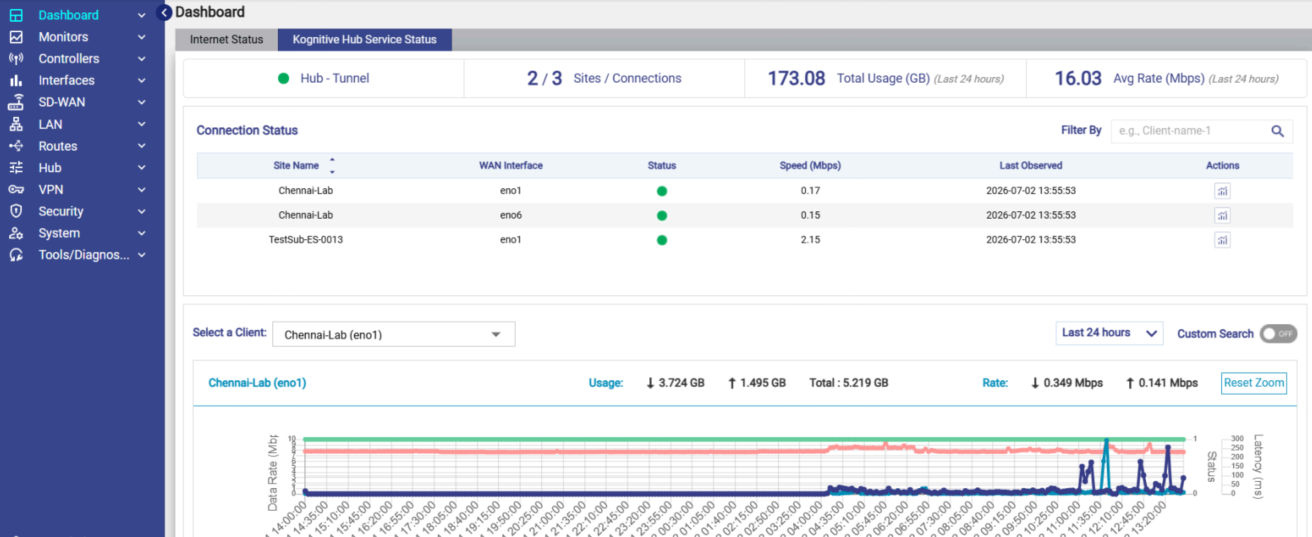
This page provides centralized monitoring and includes the following sections:
Header Summary
-
Hub - PEP/Tunnel: Displays active status along with current operating mode (e.g., Hub - Tunnel).
-
Sites / Connections: Displays the count of active connected sites versus total available site slots.
-
Total Usage (GB): Displays aggregate data consumption across all connected clients over the last 24 hours.
-
Average Rate (Mbps): Displays the average aggregate throughput over the last 24 hours.
Connection Status Table
Displays operational details such as:
-
Site Name: The designated name of the connected client site.
-
WAN Interface: The local interface bound to the client connection.
-
Status Indicator: Green (Online) or Red (Offline) connection state.
-
Speed (Mbps): Real-time link throughput.
-
Last Observed: Timestamp of the last recorded telemetry data packet.
-
Actions: Quick controls to inspect or troubleshoot individual client links.
Client Traffic Analysis Chart
-
Client Selector: Dropdown menu allowing administrators to view metrics for a specific client site and interface.
-
Time Range Selector: Supports filtering metrics over predefined intervals or a custom search range (defaults to Last 24 hours).
-
Metrics: Interactive line graph plotting real-time and historical Upload (Tx), Download (Rx), and Total Throughput with zoom capabilities.
Usage Status
-
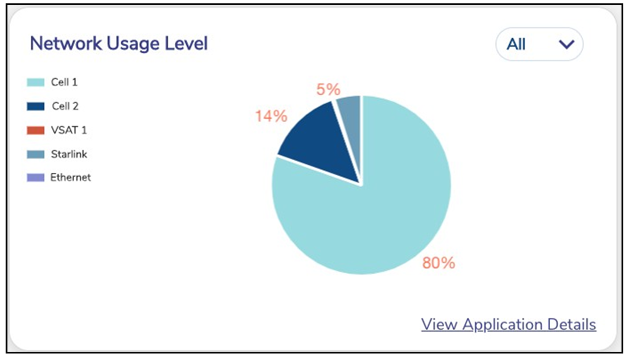
This Usage Status panel depicts the percentage of usage per Interface for a given period, see figure below. By default, the period selected is 15 minutes.
-
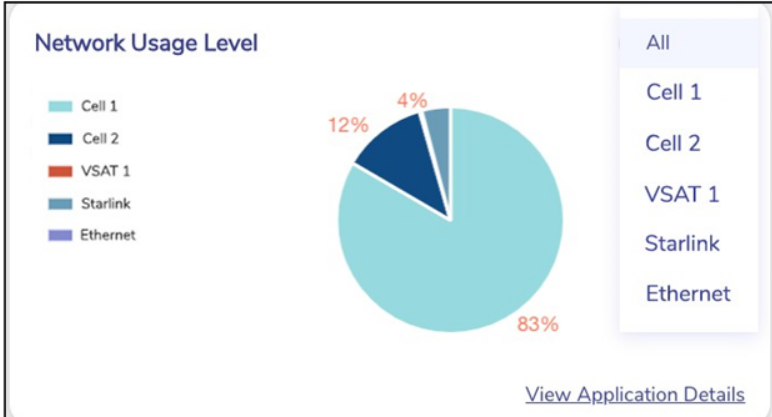
The user can also view the percentage of usage per WAN Type or per Access Network for a given period. Select the required type of filter from the dropdown menu to view the usage breakdown.
Viewing Usage for an Interface
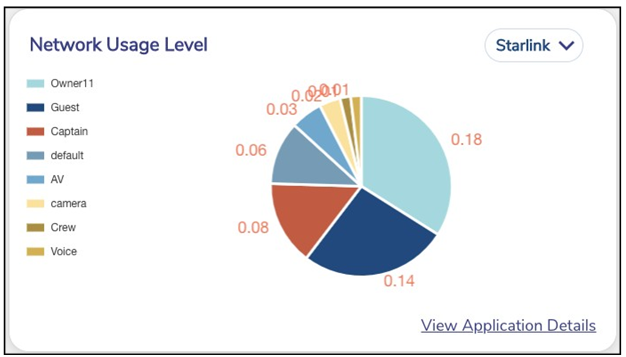
To see the % usage for an Interface across different Access Networks, perform the following steps.
-
Click the drop down on the top right of this section and select the Interface, Figure Network Usage Drop-Down Selection.
-
The pie chart updates with the details, see Figure Starlink Network Usage.
Viewing Top Applications
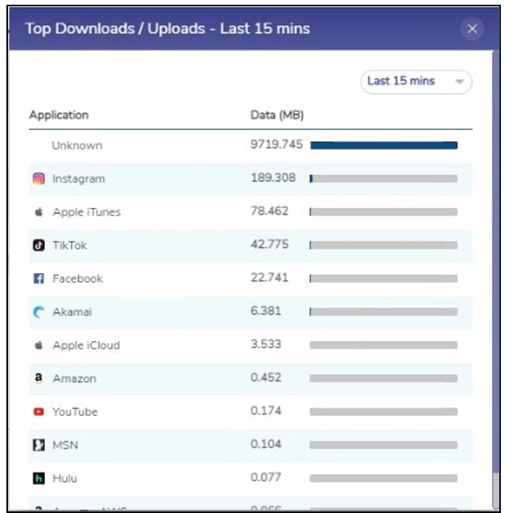
To see the Top Applications accessed for a period, perform the following steps.
-
Click the View Application Details at the bottom right of this section and select the Interface, see figure below.
-
A Pop-up with the details appears, see Figure Top Applications. By default, the periodicity set is same as that on the Internet Status screen, and can be changed through the drop down available, see Figure Change Periodicity - Top Applications.
LAN Status
-
The LAN Status panel provides the status of the LAN, Active Networks and Active Devices in the system.
For details of the fields, see table below.
|
Fields |
Description |
Configuration |
|
LAN Status |
Displays LAN Status on the server.
|
Click on LAN Status to go to Access Network Screen. |
|
Active Networks |
Displays the total active networks in the system. |
Click on Active Networks to go to Tope Networks section of the Usage Screen. |
|
Active Devices |
Displays the total active devices. |
Click on Active Devices to go to Top Devices section of the Usage Screen. |
Table LAN Status Fields
VPN
The VPN Panel displays the VPN Server and Client details and status, see figure below.
Note: If there is no VPN configuration present on the server, this section will not appear on the Internet Status Screen.
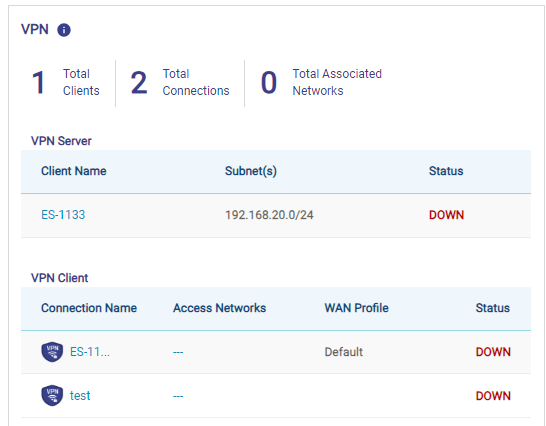
For details of the top fields in this section, see tables below.
|
Fields |
Description |
Configuration |
|
Total Clients |
This is the number of configured clients. If there are no clients configured, then this field will not be present. |
N/A |
|
Total Connections |
This is the number of configured connections. If there are no clients configured, then this field will not be present. |
N/A |
|
Total Associated Networks |
This is the number of Access Networks configured for VPN. |
N/A |
Table VPN Details
For details of the VPN Server section, see tables below.
|
Fields |
Description |
Configuration |
|
Client Name |
This is the name of the Client. |
Click the Client Name to go the VPN -> VPN Client section. |
|
Subnet(s) |
This is the list of subnet(s). |
N/A |
|
Status |
This is the status of the Client connection. It can have one of the following values. · Up icon Indicates connection is up. · Down icon Indicates connection is down. |
N/A |
Table VPN Server
For details of the VPN Client section, see tables below.
|
Fields |
Description |
Configuration |
|
Connection Name |
This is the name of the connection. |
Click the Connection Name to go the VPN -> VPN Client section. |
|
Associated Networks |
This is the list of Associated Networks for this connection. |
N/A |
|
WAN Profile |
This is the WAN Profile associated with the connection. |
N/A |
|
Status |
This is the status of the connection. It can have one of the following values. · Up icon Indicates connection is up. · Down icon Indicates connection is down. |
N/A |
Table VPN Client
Internet Profile
The Internet Profiles panel displays the Internet profiles that are associated with at least one Access Network, see Figure Internet Profiles.
For information on this section, hover over to the i icon, see Figure Internet Profiles Hover Action.
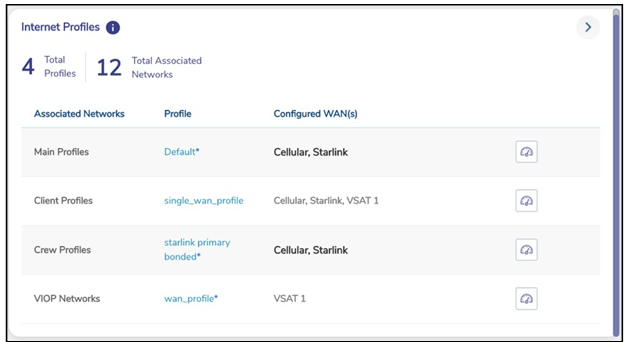
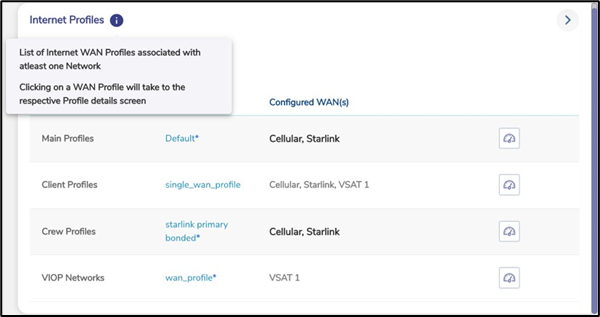
For details of fields in this section, see table below.
|
Fields |
Description |
Configuration |
|
Associated Networks |
Displays the list of Associated Networks to which a WAN Profile is assigned. |
N/A |
|
Profile |
Displays the WAN profile used by these Associated Networks. |
Click on the WAN Profile to go to the WAN Profile screen on the Configuration Wizard. The WAN Profile appears on this screen. |
|
Configured WANs |
Displays the list of WANs configured in the WAN Profile in priority order, with the active WAN highlighted in bold. Bonded WANs in a profile are shown in brackets. |
N/A |
|
Speed Test |
This allows to run Speed test over ‘bonded’ links, or any WAN links based on the WAN profile configured for the Access Network. |
To perform Speed Test over bonded links, see section Figure Performing Speed Test on a Bonded Link. |
Table Internet Profile Fields
Performing Speed Test on a Bonded Link
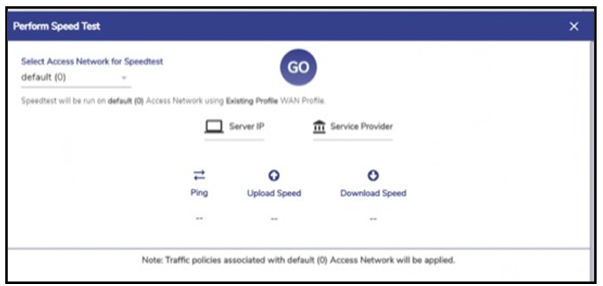
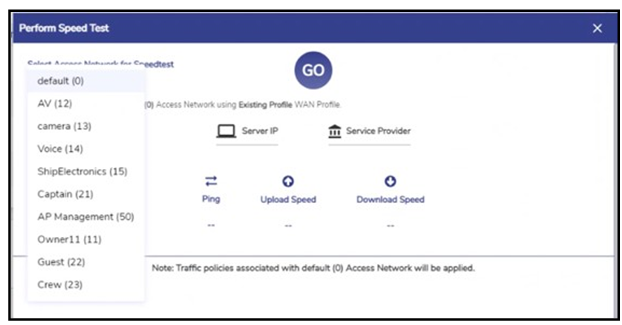
Note: The Speed Test traffic follows the Traffic policies assigned for that Access network. If there are multiple Access Networks using the same WAN profile and the user wants to run the Speed Test over the specific Access Network, the same can be selected from the drop down.
To perform Speed Test on a Bonded Link, perform the following steps.
-
Click Speed test icon corresponding to the WAN Profile. The Speed Test Pop-up appears, see Figure Bonded Link Speed Test.
-
Click the drop down to select the Access Network on which the user wants to run the Speed Test on, see Figure Bonded Link Speed Test Drop Down.
-
Click GO.
The Speed Test results appear on the Pop-up after completion of Speed Test run.
Viewing Detailed Status of WAN Profiles
To see detailed view of WAN Profiles, perform the following steps.
Steps
-
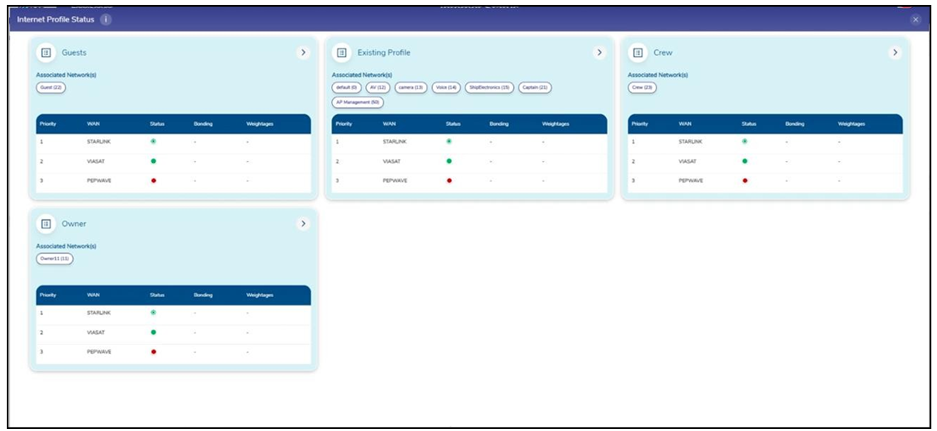
Click Right arrow

-
The user can see the WAN Profiles in the system along with the status of the WANs, Bonding and Weighting details.
-
User can change the WAN Profile associated with an Access Network by dragging the Access Network from the current WAN Profile card to the new WAN Profile card.
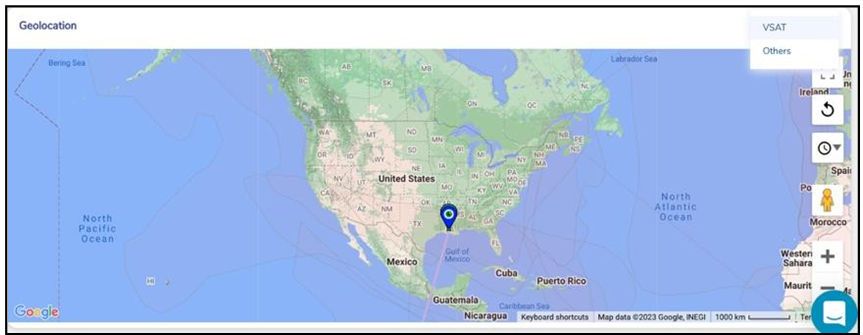
Geolocation
The Site Location and Voyage Path can be viewed on the Geolocation panel, see figure below.
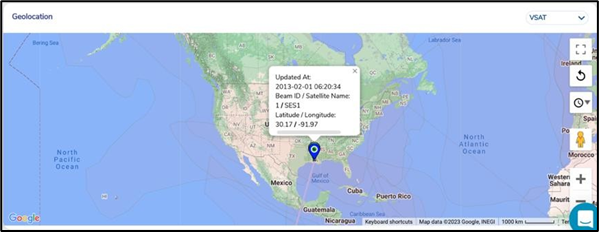
By default, the VSAT geolocation map is plotted, however if this is not available, then Cellular map is plotted, and if this is also not available, then it is updated from other source. It is possible that in the absence of any source having this data, this section will be blank. The user can select the desired source from the Source drop down on the top right of this section to view the respective map, see Figure Geolocation - Others.