
-
Select the WAN Usage tab to view the usage details of all WAN Interfaces.
-
In the Organization field, select the Organization or sub-organization from the dropdown menu. The logged in admin Organization is populated by default here. This is the organization corresponding to the email ID used to login.
-
The dropdown list consists of all the sub-organizations under logged in admin organization.
-
Select the Sites from the dropdown menu.
-
Select the Period from the dropdown menu.
-
By default, the time interval selected is last one hr. The user can also select a custom time interval using the From and To fields.
-
The WAN Usage tab shows the usage data as shown in the below figure.
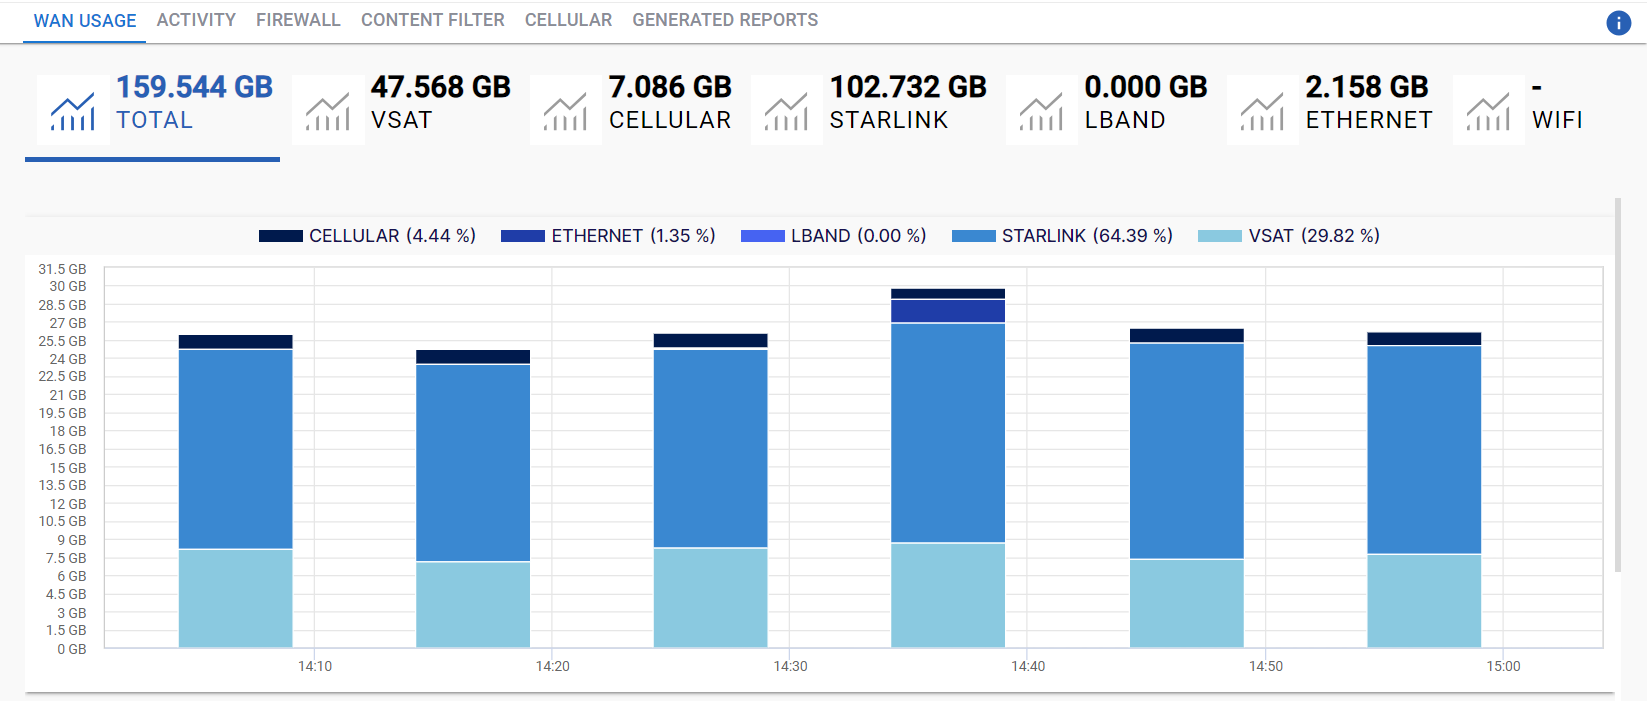
The headers show the following information:
-
Total - The total amount of data consumed across all WAN Interfaces of the selected organization or sub-organization in GB.
-
VSAT - The amount of data consumed by the VSAT interface.
-
Cellular - The amount of data consumed by the Cellular interface.
-
Starlink - The amount of data consumed by the Starlink interface.
-
LBand - The amount of data consumed by the Lband interface.
-
Ethernet - The amount of data consumed by the Ethernet interface.
-
Wifi - The amount of data consumed by the Wifi interface.
-
Clicking any of the headers filters the entire screen and displays the data usage information corresponding only to that selected WAN Interface.

-
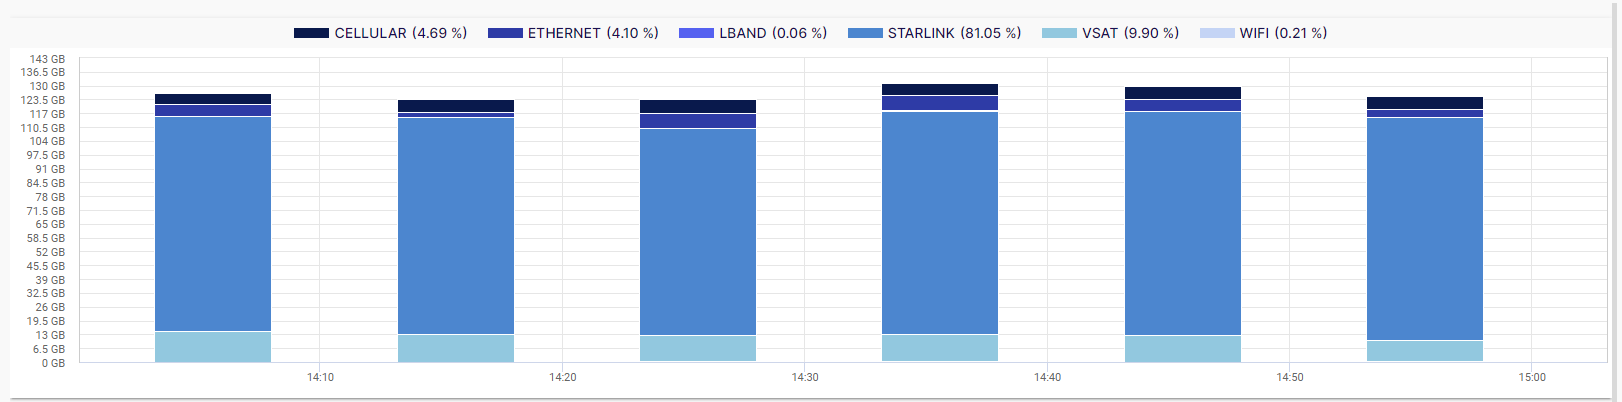
The data usage of various WAN interfaces is shown in the format of a bar chart. The horizontal axis contains the time instances, and the vertical axis contains the amount of data used by them.
-
The graph between these two axes gives the user a clear understanding of the data consumption during the selected time interval.
-
The WAN Interfaces can be differentiated using the legend at the top of the chart.
-
All the sites of the selected organization are listed in the List of Sites table along with their data usage.
-20240524-152505.png?cb=220db0c7facdaf5eaf4ef8b4e9f2805e)
-
Select the dropdown menu at the top right corner of the table to change the number of sites listed in the table.