
-
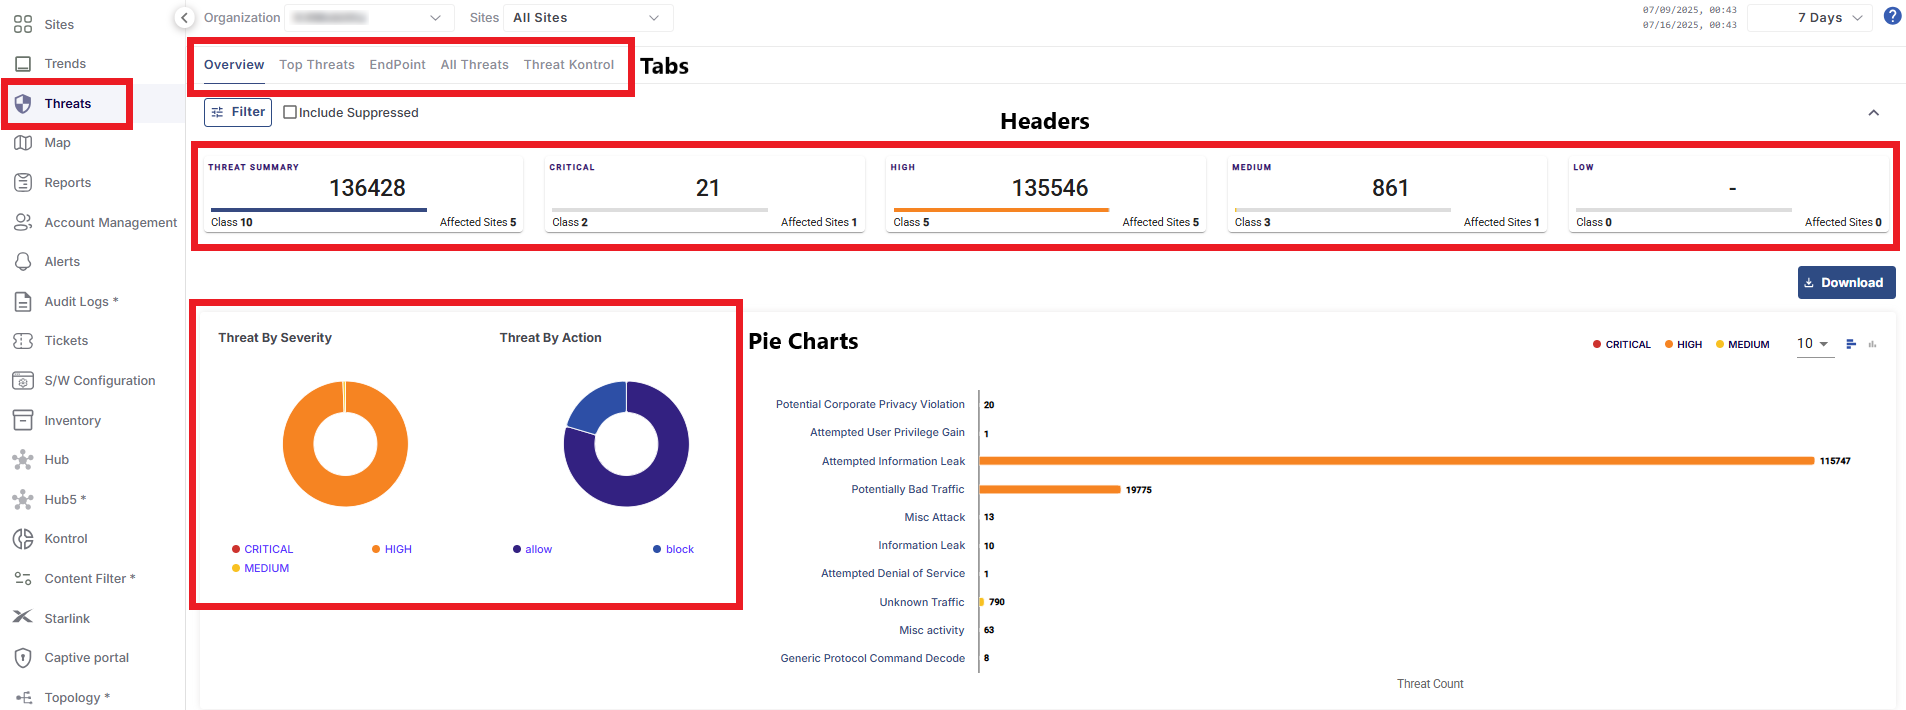
The Overview tab is selected by default.
-
The cards show the following information:
-
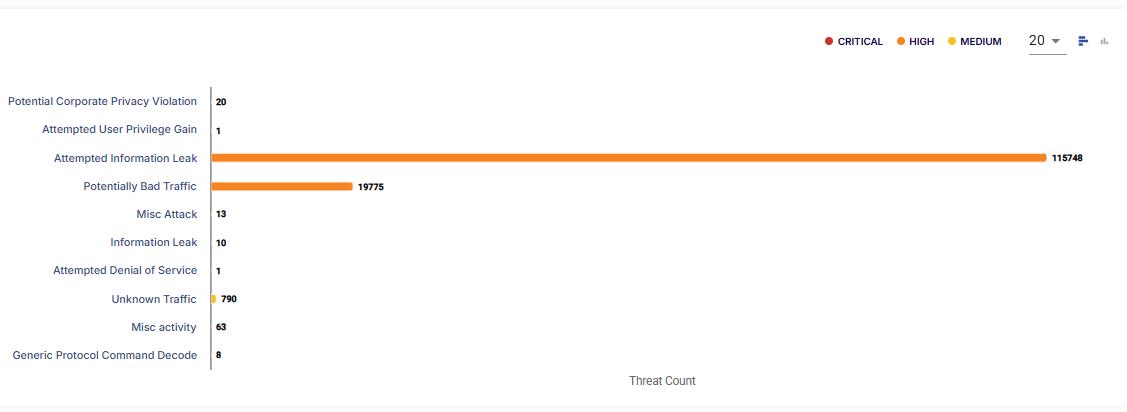
Threat Summary - The total number of Threats received across the selected Organizations. It also shows the number of Classes of threats involved and the number of Affected Sites. Classes are nothing but the categories of Threats. Threats have various categories. These categories will be explained in following sections.
-
Critical - The total number of Critical severity Threats received.
-
High - The total number of High severity Threats received.
-
Medium - The total number of Medium severity Threats received.
-
Low - The total number of Low severity Threats received.
-
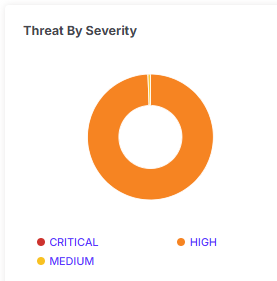
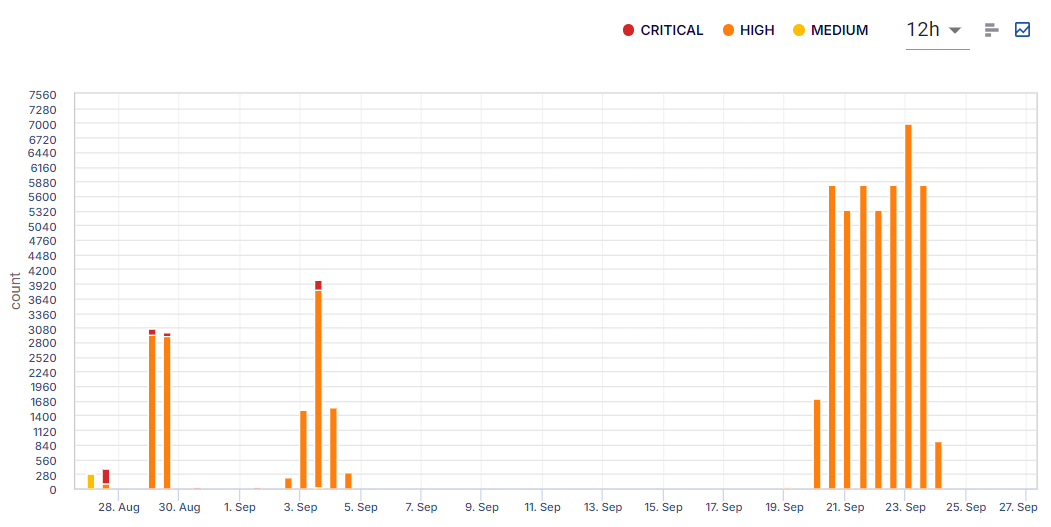
Threat By Severity
The Threat By Severity pie chart shows the percentage of threats based on their Severity level. Hovering the cursor on any item on the pie chart highlights the severity and shows the percentage of the selected item.
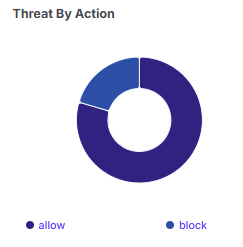
Threat By Action
The Threat By Action pie chart shows the percentage of threats based on their Action taken. The actions available in the system are Allow and Block. Hovering the cursor on any item on the pie chart highlights the severity and shows the percentage of the selected item.
Click the ![]()
Click the ![]()
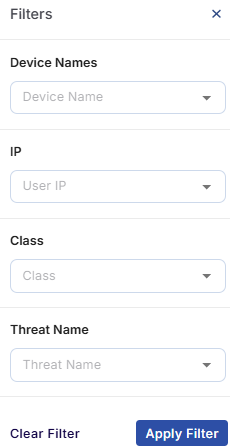
Filter
The Filter button can be used to filter the Threats - Overview screen based on the Device Names/IP Address/Class/Threat Name.
-
Select the Device Names from the dropdown menu.
-
Select the IP from the dropdown menu.
-
Select the Class of the threats from the dropdown menu.
-
Select the Threat Name from the dropdown menu.
-
Click Apply Filter button to filter the Threats - Overview screen and show the threat details corresponding only to the selected filter parameters.