
The Alerts tab shows the summary of all the alerts raised for the user’s account. It shows the Alerts and their information in a table as shown in Figure Alerts Tab.
-20240607-122045.png?cb=3cb524dd76ad8536c85afcadc29bfc1c)
-
By default, the table only shows the current alerts - Alerts that are currently in Alerting status.
-
Click the Toggle button to show the History of both the Normal and Current alerts as shown in Figure Alerts History.
-20240607-122309.png?cb=58d7c46abee401b304a8be02f0be445b)
-
Select the Period if necessary.
-
The Alerts table shows the following information:
-
Site - Name of the Site
-
Device Name - Name of the device
-
Alert Name - Name of the Alert
-
Interface Name - Name of the Interface
-
WAN Type - Type of WAN Interface that received the alert
-
Reported On - Date and Time of the alert
-
Status - Status of the Alert (Alerting / Normal)
-
Details - Shows the Metadata code with details such as Device ID, Site ID, Type.
-
-
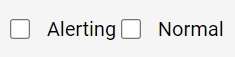
Select the Alerting or Normal checkbox to filter the table based on the Status of the alerts.
-
Click Download button to download the Alerts table information in CSV format.
-
The Search field can be used to search for the alert based on the Site/Device name/Alert name/Interface name/WAN Type.
-
In the Auto Update field, select the custom time interval from the dropdown menu for automatically updating the alerts table.